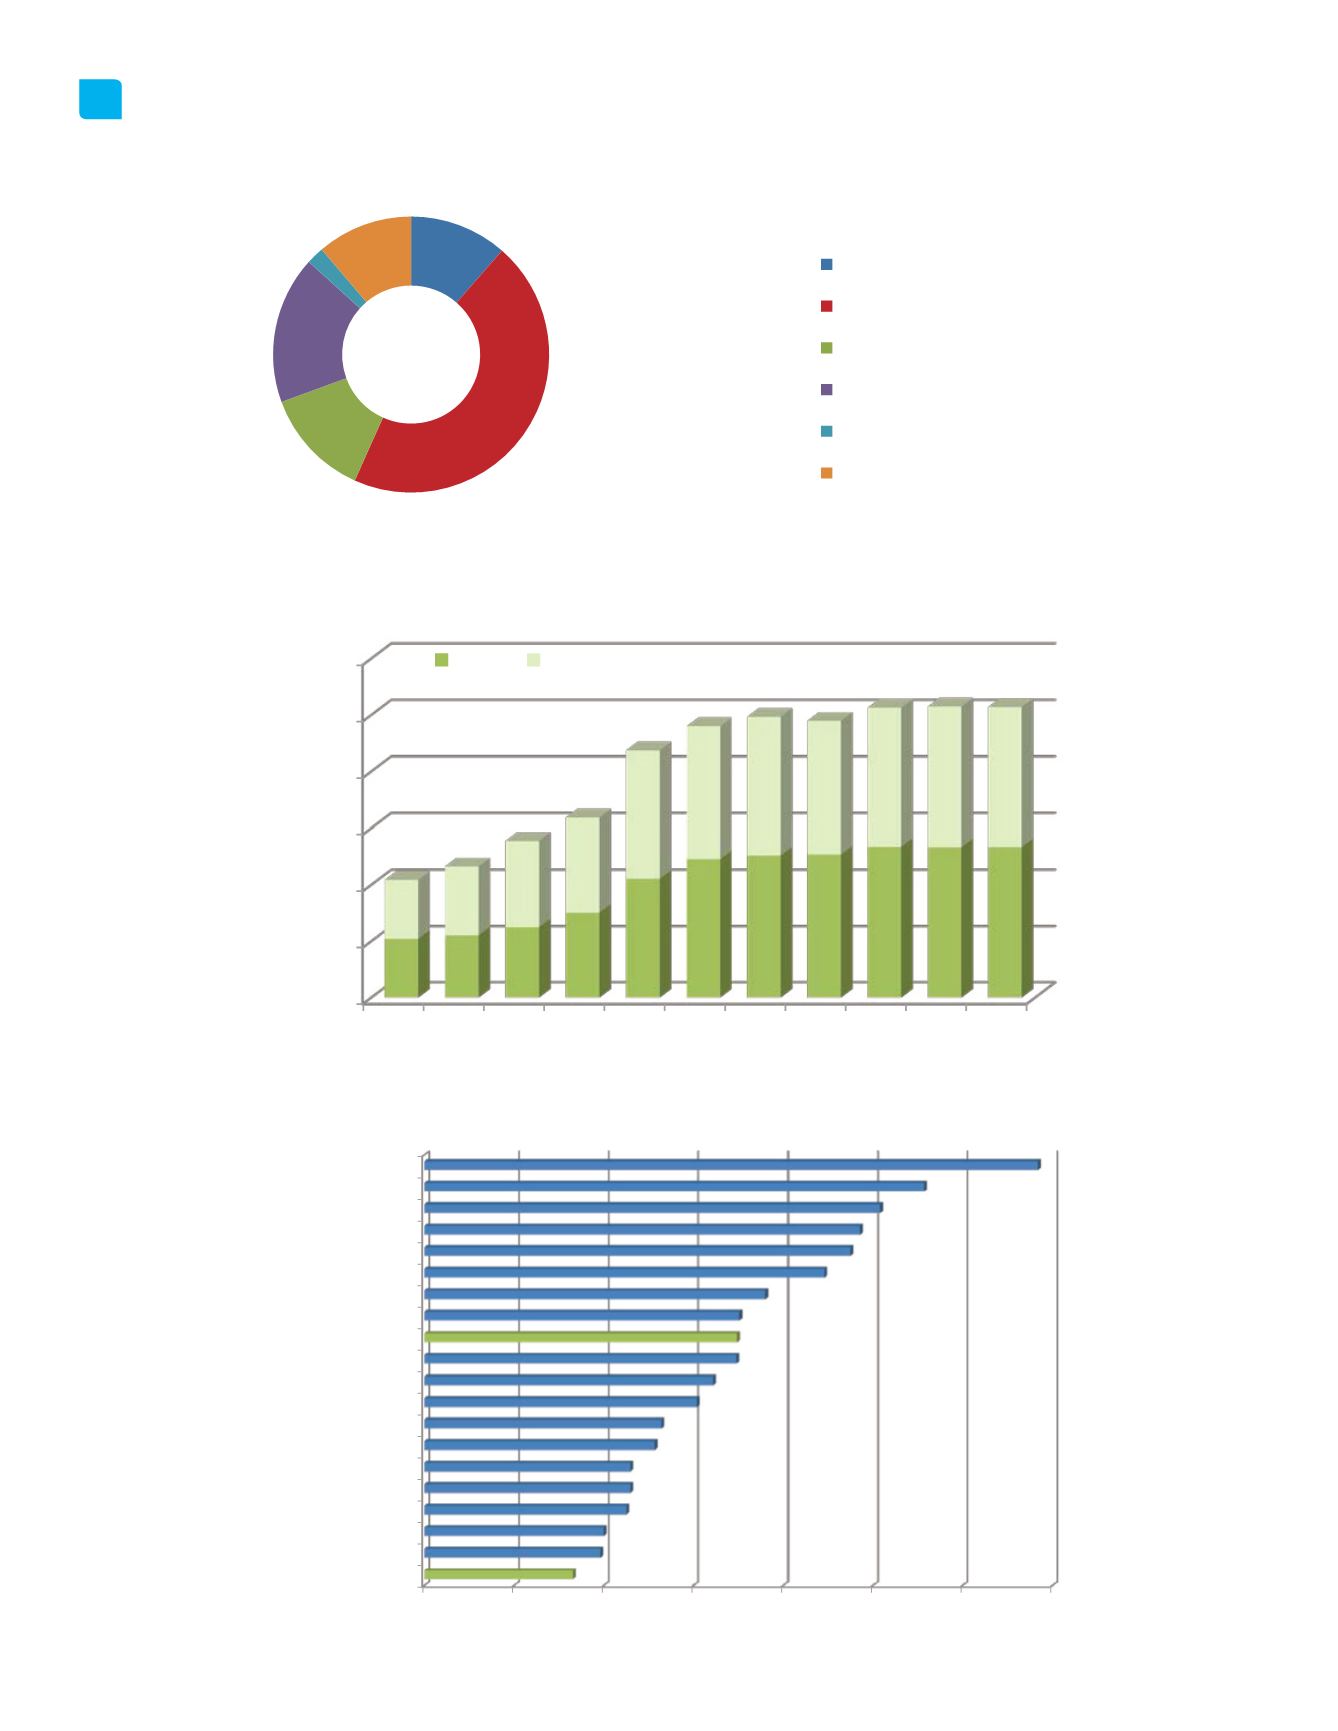
$0
$2,000
$4,000
$6,000
$8,000
$10,000
$12,000
2003 2004 2005 2006 2007 2008 2009 2010 2011 2012 2013
$2,085
$2,203
$2,496
$3,012
$4,210
$4,905
$5,033
$5,067
$5,343
$5,331
$5,332
$2,089
$2,451
$3,057
$3,360
$4,539
$4,692
$4,900
$4,728
$4,910
$4,968
$4,951
Millions
Chilliwack Property Assessments
Land Improvements
$0
$200,000 $400,000 $600,000 $800,000 $1,000,000 $1,200,000 $1,400,000
Chilliwack
Mission
Abbotsford
Pitt Meadows
Langley (City)
Maple Ridge
Langley (Township)
Port Coquitlam
Delta
Surrey
New Westminster
Average
Coquitlam
Port Moody
North Vancouver (City)
Burnaby
Richmond
North Vancouver (District)
Lions Bay
Vancouver
Lower Mainland - Representative House Value
12%
45%
13%
17%
2%
11%
Municipal Tax Distribution
General Government
Protective Services
Transportation
Parks, Recreation & Culture
Planning & Development
Fiscal Services
Statistical Information
36


